
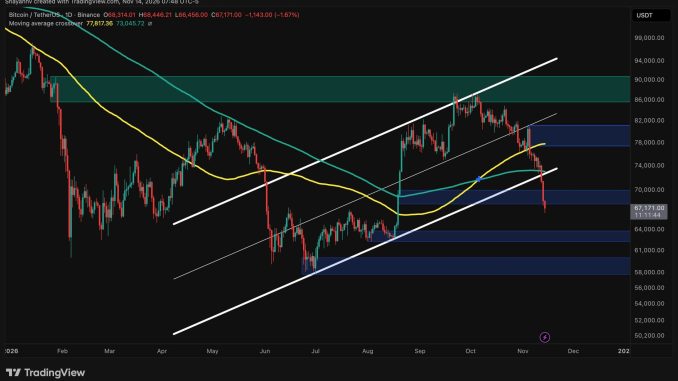
Bitcoin’s correction has sped up over the past week and is now dropping almost vertically. It currently trades around $65K after cutting through several support levels. The latest drop pushed BTC below its daily ascending channel and the key $70K support zone, which leaves deeper demand areas exposed. Meanwhile, the Adjusted SOPR metric indicates that coins moving on-chain are now, on average, being spent at a loss again, which is not a good signal.
Bitcoin Price Analysis: The Daily Chart
On the daily chart, Bitcoin has broken below the lower boundary of the ascending channel that guided its recovery from the June lows. The breakdown followed a rejection from the $80K zone in early November. It also slipped both the 100-day and 200-day moving averages, located around $78K and $73K, respectively. This is notable, as the two averages printed a bullish crossover only in early October.
The price has also slipped below the $70K zone, which marks the base of the sharp August rally. To invalidate the breakdown, buyers would need to reclaim this level and then the $73K region, where the channel’s lower boundary and the 200-day moving average meet. Until then, the former support could act as resistance on any relief rally.
If selling pressure continues, the next demand zone sits around $63K, where the price consolidated during August before the breakout. Below that, the $60K region, which formed the June–July lows, is the more significant floor. A decisive daily close beneath it would effectively erase the recovery structure of the past five months.
BTC/USDT 4-Hour Chart
The 4-hour chart shows Bitcoin trading within a descending channel since the late-September rejection from the $86K-$87K supply zone, with consistently lower highs and lower lows. The latest attempt to break above the channel’s upper boundary was rejected around $81K in early November, and an aggressive sell-off followed.
The decline first broke the channel’s lower trendline and the $76K demand zone, then accelerated through $70K. BTC briefly dropped toward $65K and is now consolidating around $65.5K, with buyers showing only a minor reaction so far. A relief bounce would likely meet resistance at the $70K zone, which sellers could now defend as supply.
On the downside, the next notable demand lies around $63K, matching the base of the August consolidation on the daily chart. Until BTC reclaims $70K, the short-term structure remains bearish. Any rebound below that level would more likely be a pullback than a reversal.
On-Chain Analysis
The Adjusted Spent Output Profit Ratio (aSOPR) on CryptoQuant measures whether coins moved on-chain are, on average, being sold at a profit or a loss. It excludes very short-lived outputs. Readings above 1 indicate profit-taking, while values below 1 suggest participants are realizing losses. The chart tracks the metric’s 30-day exponential moving average.
The indicator stayed above 1 for most of 2025 and peaked near 1.07 during the late-2024 rally. It dropped below the threshold in early 2026, reaching approximately 0.98 as BTC fell toward $60K, and dipped again during the June–July lows. After recovering to around 1.013 in October, the 30-day EMA has now fallen back below 1, currently near 0.995.
This shift suggests that recent buyers are selling at a loss, a condition that has often coincided with local bottoms as selling pressure exhausts. However, the metric could decline further, as it did in February. A sustained move back above 1, together with a reclaim of $70K, would be a more convincing sign that the selling phase is easing.
Disclaimer: Information found on CryptoPotato is those of writers quoted. It does not represent the opinions of CryptoPotato on whether to buy, sell, or hold any investments. You are advised to conduct your own research before making any investment decisions. Use provided information at your own risk. See Disclaimer for more information.



Be the first to comment